This is a visualization project with Bell Museum at St. Paul, Minnesota, presented on May 4th, 2019. Intended audience are visitors to the Museum at all age, biology researchers, university students.
I work in small team with Yichun Yan, instructed by Prof. Daniel Keefe and Bell Museum. I’m mainly responsible for the visual part, including model design, coding in Processing and Javascript (P5.js) for the model and UI design for the website.
It is a visualization task for understanding the physical reality of food webs. In order to depict food webs graphically, I designed several models that capture the richness, topology as well as dynamics of the system, and served as a comparison to the existing display at the museum. As a visualization tool for the audience at the museum, it proved to have an excellent user experience, which allows for convenient interaction. The audience was guided through an interactive tour from Lake Superior to the ocean, from ecosystem to every single species inside. There is also a game inside, which is creative and fun. Children were especially engaged during our demonstration; they were excited to learn using this tool. What makes the project stands out is that they make connections to the knowledge we covered in class, including color, graphs, and storytelling to convey information.
Presentation website demo: FoodWebVis, Code
Introduction
The first page of the website:
shows a randomly generated food chains which corresponds with the the food web which is presented at Bell Museum:
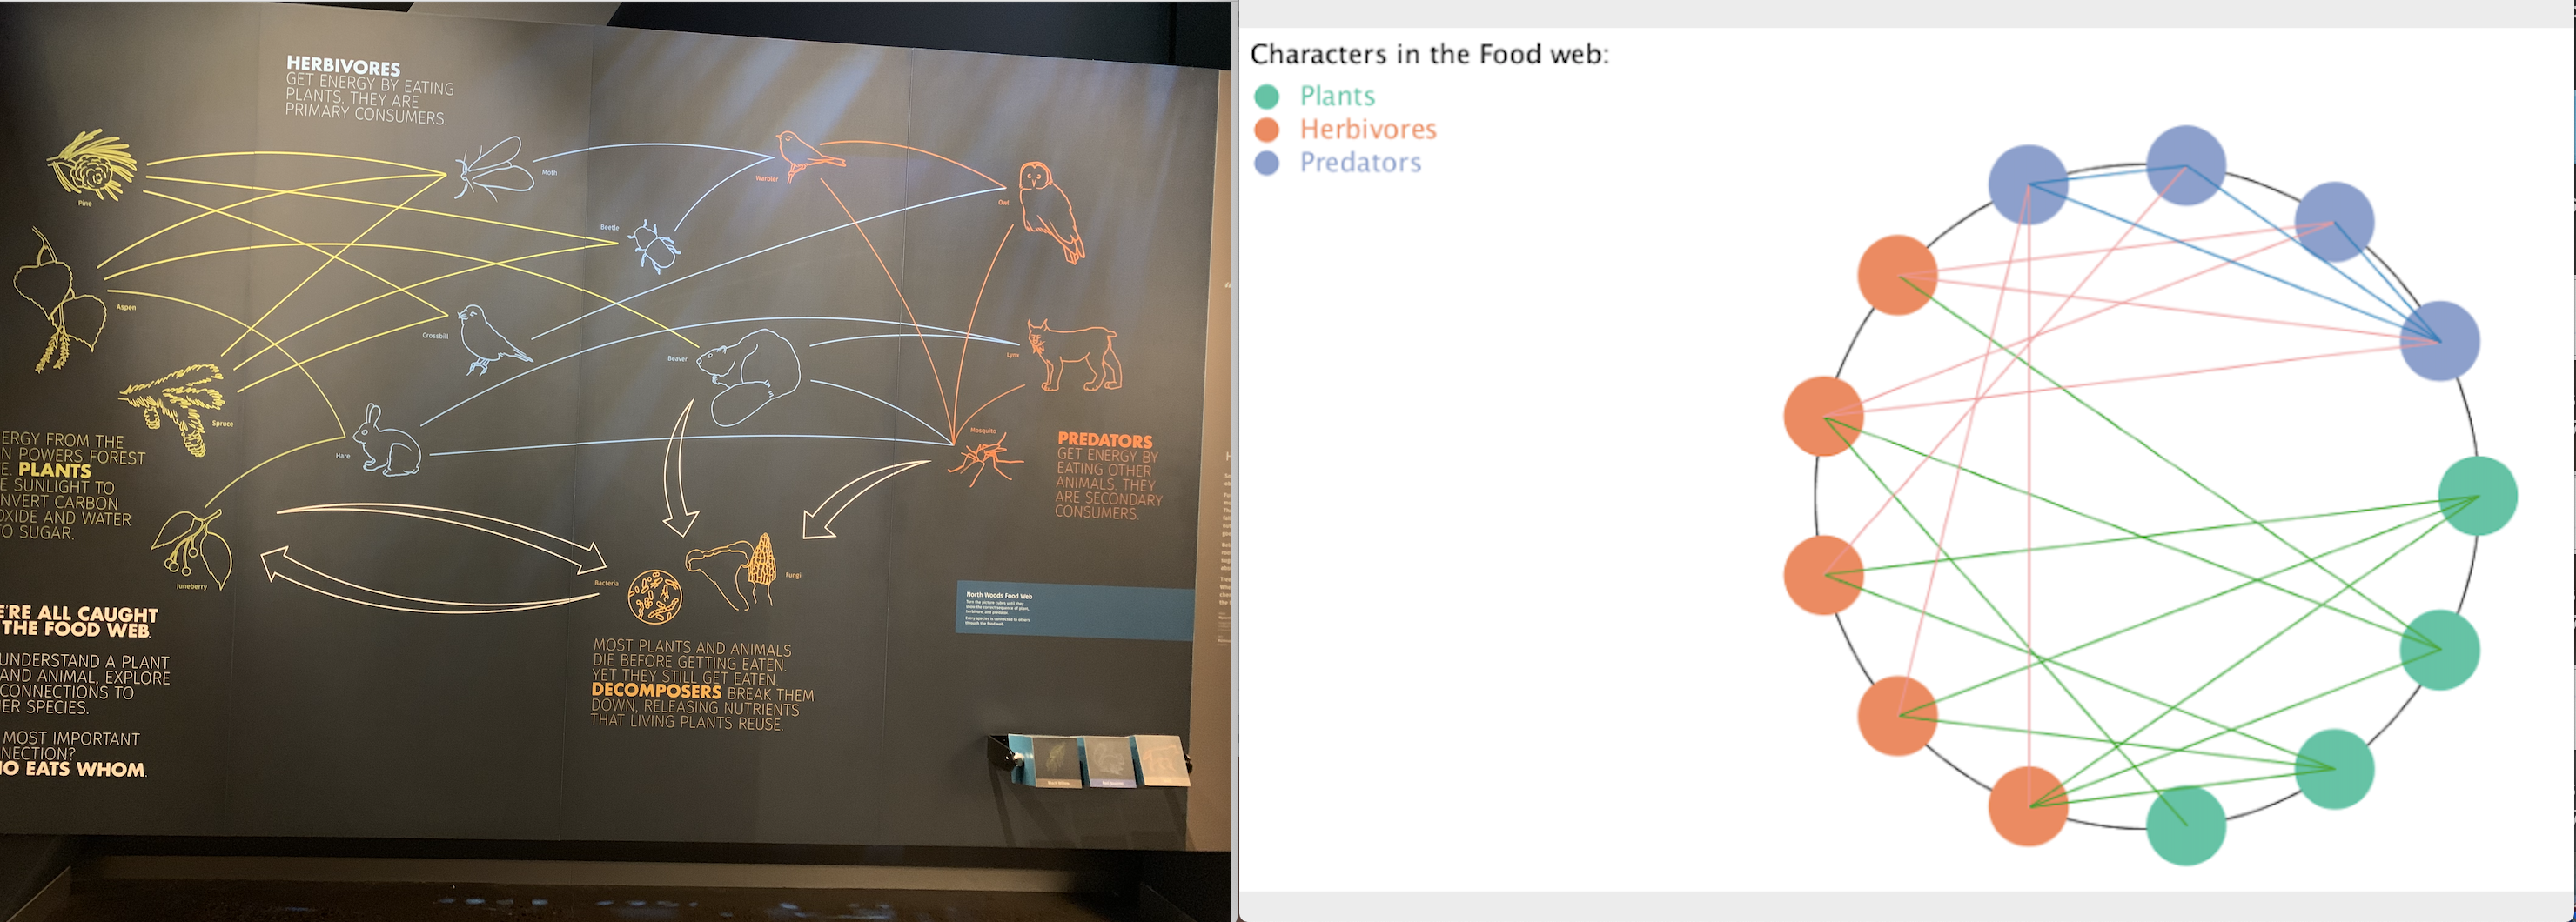
An food web example in Minnesota:
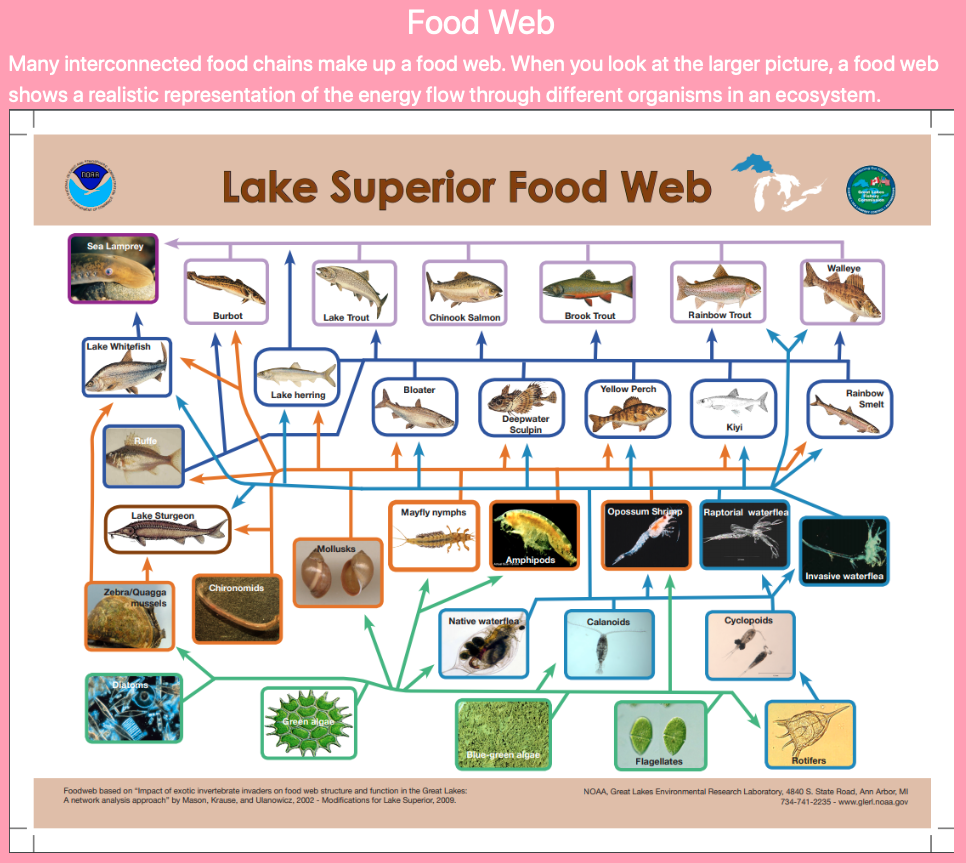
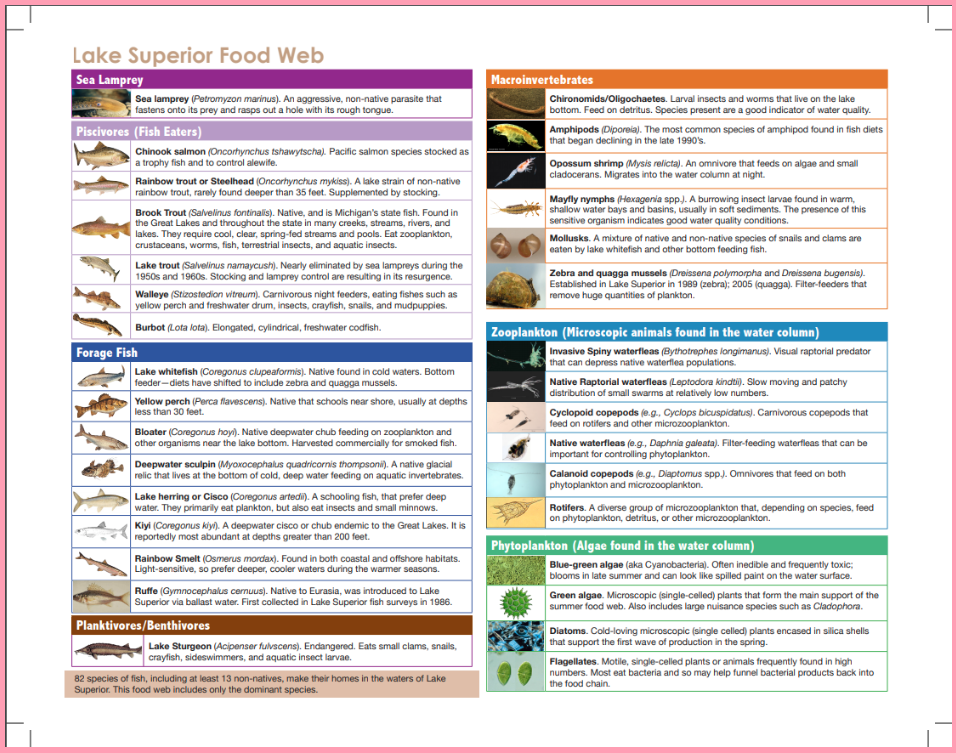
Food web in ecosystems
However in real world, food webs are much more complex than the ideal model in the museum, thus they cannot be represented by the method above. In order to help audience learn more about the real food webs, we design several ways of visualization.
Click on the Ecosystem button on the menubar, and choose the ecosystem that you are interested in from the dropdown. For example, Carpinteria from IWDB, which is a salt marsh. The layout is as follows:
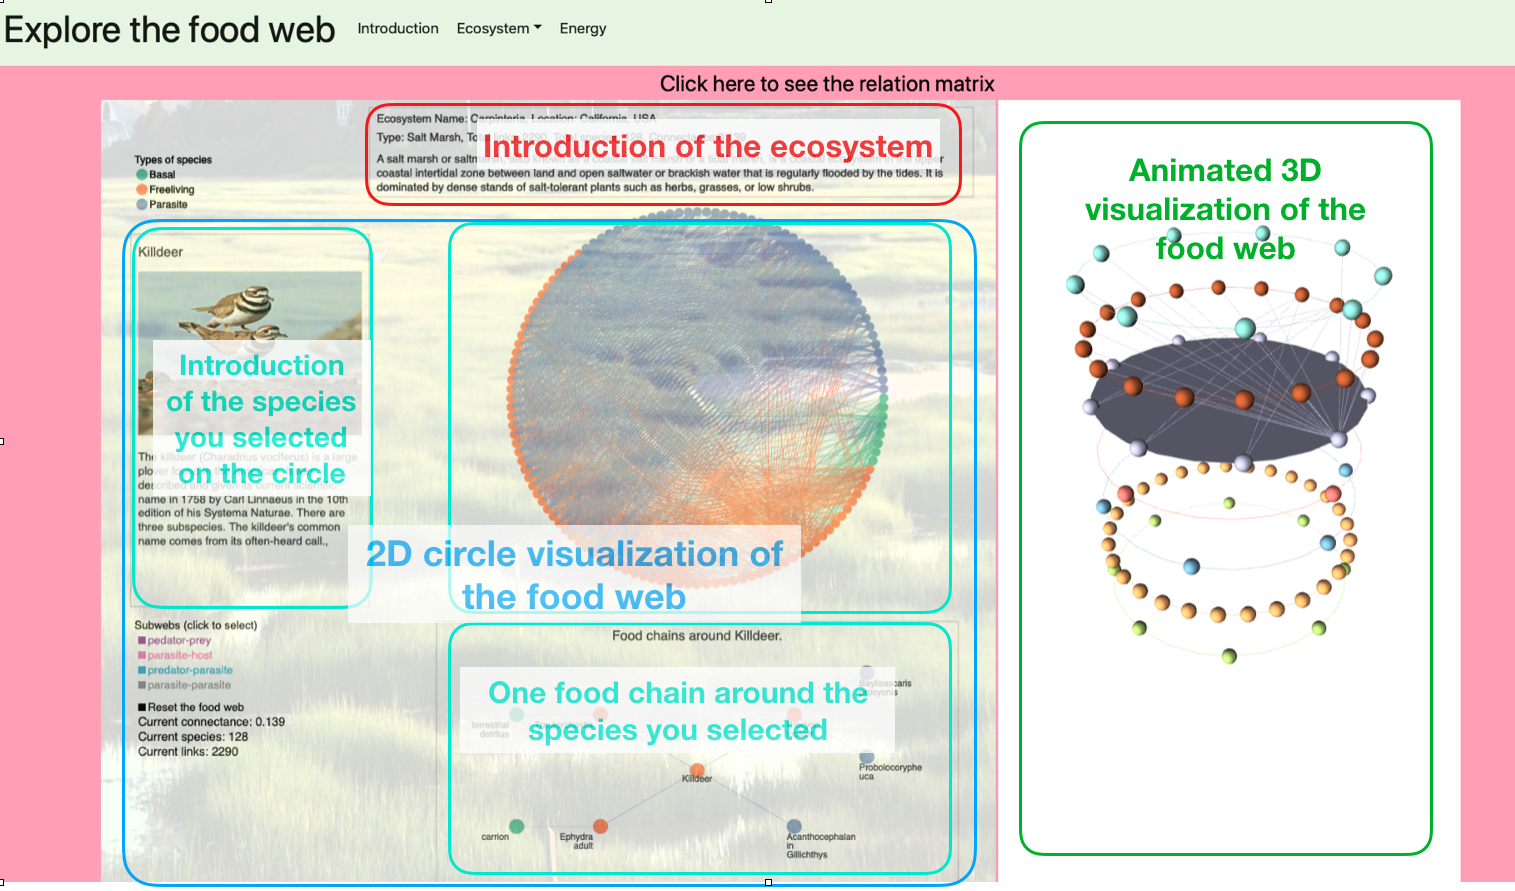
- The 2D circle visualization puts each species around the big circle and connect each pair of interaction(e.g. predator-pray) with lines. Color represents different groups. In this way, we can learn about the complexity directly. Background is a picture of this ecosystem.
- click on the “subwebs” labels on the left bottom to select which subweb(s) to display, in order to simplify the model,
- click on each point on the circle to learn about this species, the information is shown on the left box, and the food chain around it is shown below. It helps audience learn what’s in this ecosystem in details,
Although richness and topology are captured by graphic depictions, the utility of the depictions is often limited to impressing upon the viewer the overwhelming structural complexity of the systems. In fact, it is more complicated than illustrated, being based on a dataset comprising 128 species and 2290 interspecific interactions. We need to provide some statistics, for example, connectance, a number of measures and summary statistics are used to describe and compare food webs, which shown on the left bottom side. C = L/S^2, where L is the number of directional links in the network, and S is the number of nodes or species. Connectance values are generally well below one, reflecting the relative sparsity of links in food webs.
Audience can compare the number of species and interaction, connectance between different ecosystems. What’s more, they can double click on the species on the big circle to remove the species from the system, connectance will change. However, different species play different role in the ecosystem, thus having different influence on the ecosystem. It is an innovative approach to discover the importance of a certain species.
Notice that no species can be independent from the whole ecosystem, every one of them is indispensable to the food web.
- The animated 3D structure put species of the same trophic level at certain height around a circle, and shows how energy flow in to nect trophic level by connecting each interaction. It is hierarchyical model which is similar to the Ecological Pyramid (or Trophic pyramid). Unlike the 2D visualization that puts all links inside one circle, which is messy, this model describles the structure of each trophic level clearly, and animates the process of energy flow. It allows for user interaction. Audience can zoom in/out and rotate with mouse control.
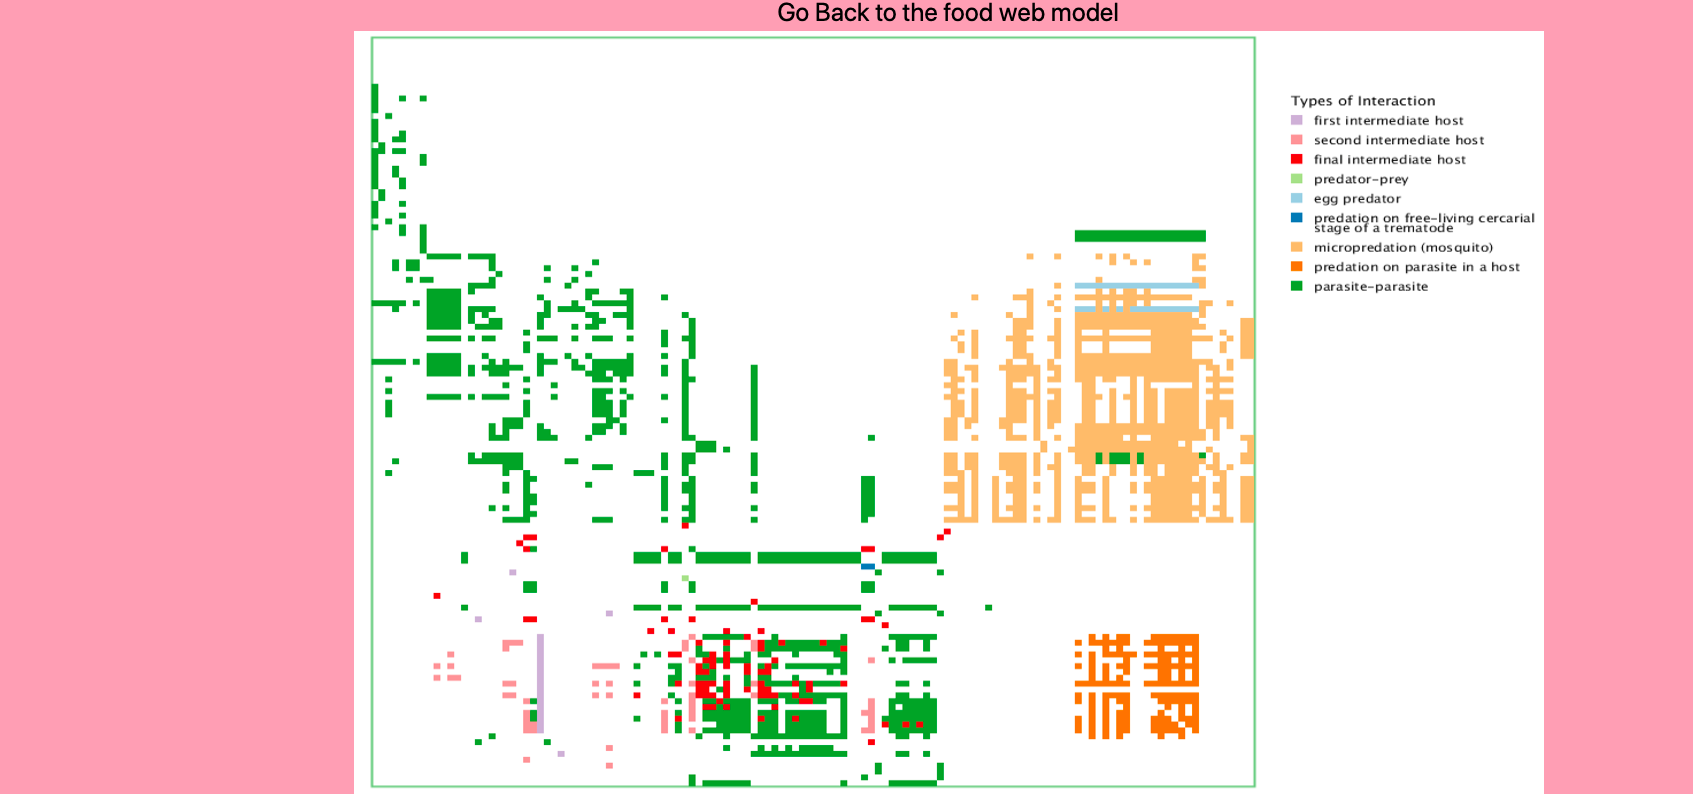
- The interaction matrix which is shown on the bottom is a simple and direct way to depict the interactions in the ecosystem, to get an overview of structure and complexity.
Besides Carpinteria, there are other ecosytems for audience to explore:
- Baja California, an ocean ecosystem, is much more complicated. In the ocean, small fish is eaten by big fish, big fish is eaten by bigger fish… thus forms long food chains. There are 11 trophic levels:
- Berwick, a pine forest:
Energy pyramid
Click on “Energy” on the menu. This is a small game to illustrate energy pyramid and significance of environmental protection.
An energy pyramid is shown as below, a graphical representation designed to show the biomass or bioproductivity at each trophic level in a given ecosystem. each point stands for a species, the lowest level consistd of producers like plants and alges, top level are mainly big predators.
Click on speices to add energy or plastic waste to it, and see how they transfer along the food web:
- An energy pyramid is a presentation of the trophic levels in an ecosystem. Energy from the sun is transferred through the ecosystem by passing through various trophic levels. Roughly 10% of the energy is transferred from one trophic level to the next, thus preventing a large number of trophic levels. There must be higher amounts of biomass at the bottom of the pyramid to support the energy and biomass requirements of the higher trophic levels.
- When plastic is part of the food chain:
Microplastics are plastic pieces smaller than 5 mm. This can include extremely small plastic pieces used in household products, clothing fibres and large plastic pieces that degrade into smaller fragments.
Microplastics can accumulate in fish, birds and other marine life. Because they do not break down rapidly, the amount in the sea and fish will continue to accumulate, making the problem worse over time, until we manage to reduce the amount of plastic in the sea.
