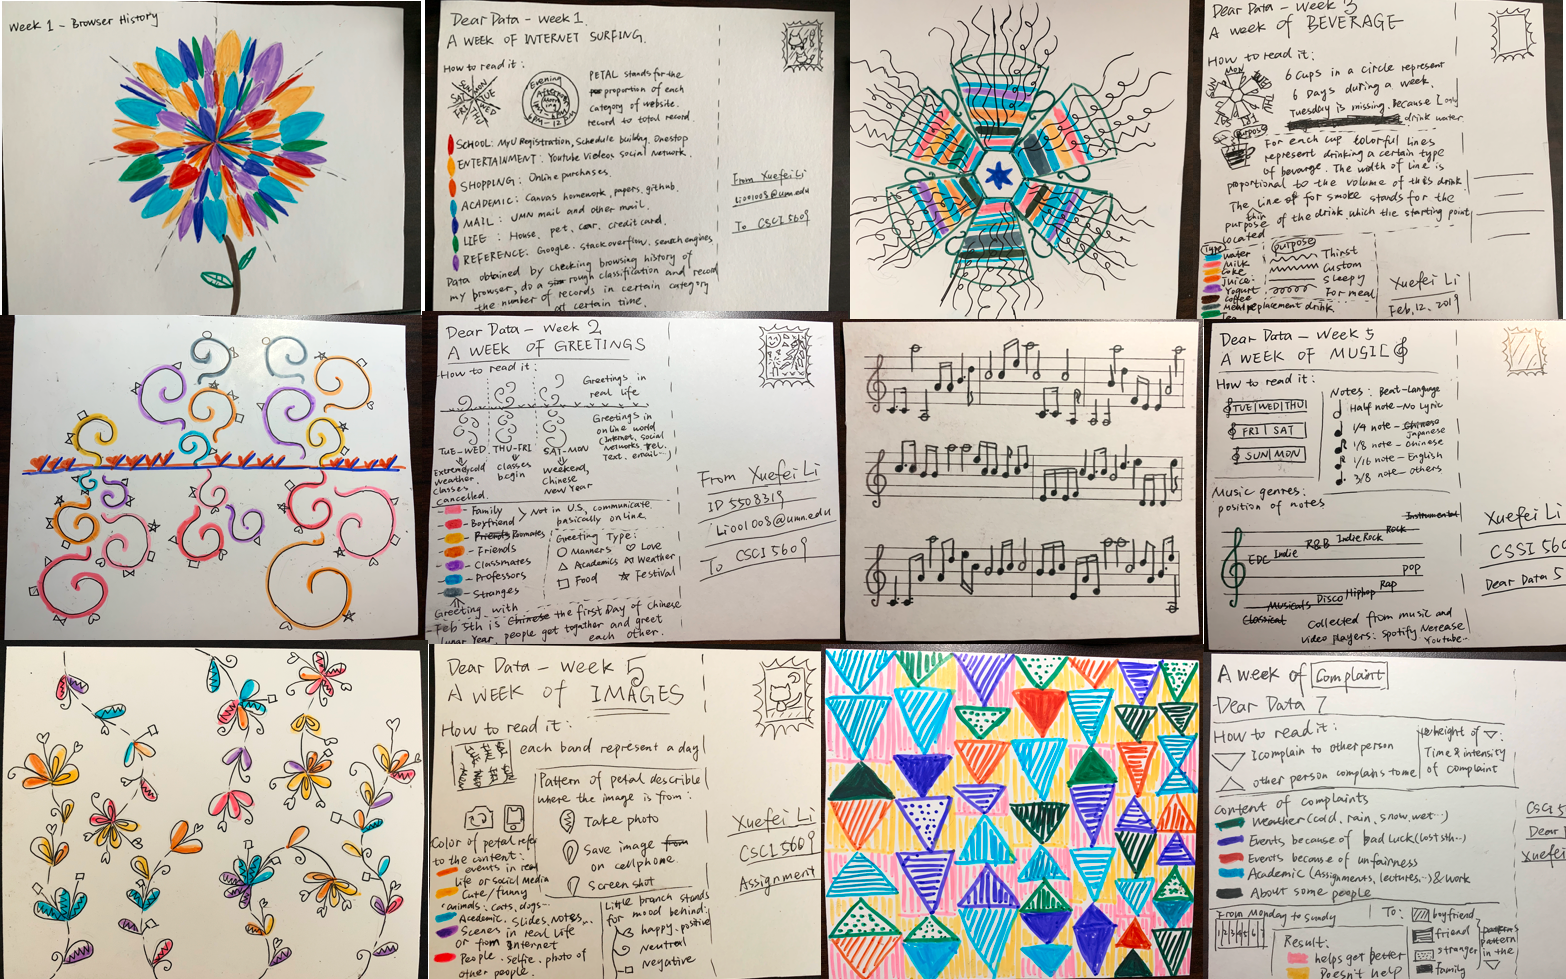
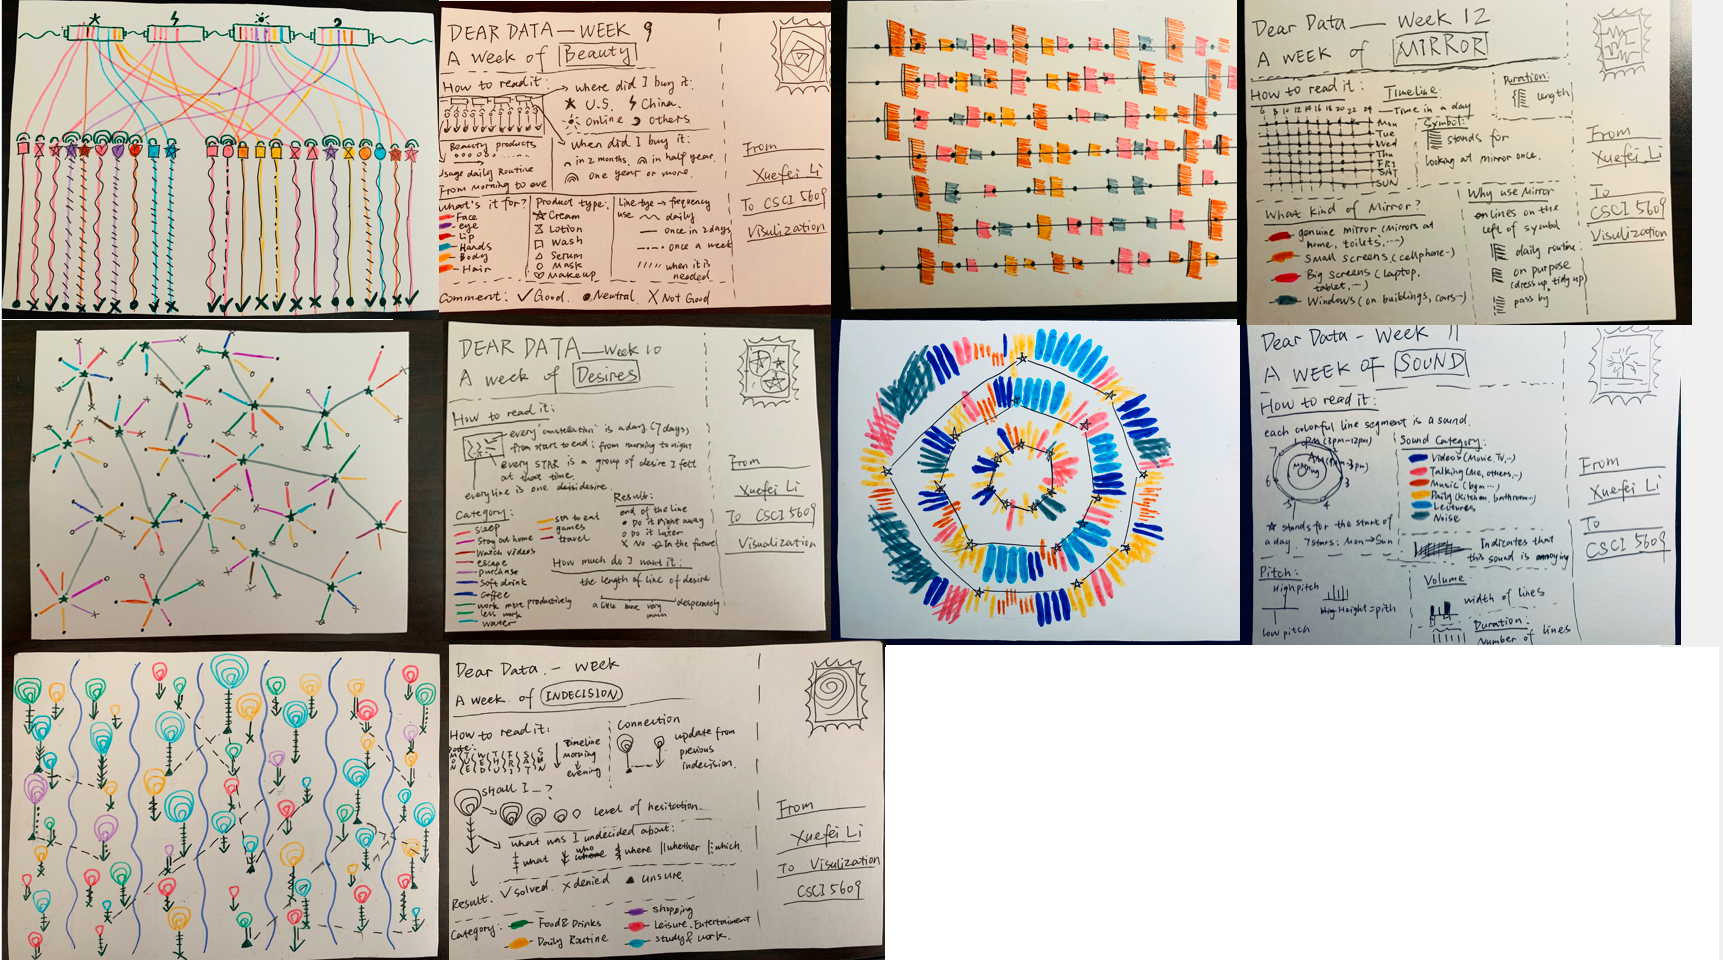
Introduction
Weekly “visual creativity enhancing” exercise, making us think creatively about new ways of mapping data to visuals and quickly prototype them. If they seem to work well, then we might later program a visualization to use the same visual style. What’s more, the process of collecting our own data will make us think about and develop a more “humanistic” approach to working with data. There is always a human somewhere behind the data, and, as a discipline, we need to become more aware of this throughout the entire data science pipeline.
To know more about the “Dear Data” project: Georgia Lupi’s Ted Talk.
Collect Some Data During the Week
Design a Creative Mapping from Data to Visual
Create a Postcard-Sized Visualization with Non-Traditional Visualization Media
My works